
One of the biggest differences between average traders and great traders is understanding how multiple timeframes work together.
Most traders only look at a single chart.
Maybe the one-minute.
Maybe the daily.
Maybe the five-minute.
But the best setups in trading usually happen when multiple timeframes are aligned at the same time.
That alignment can dramatically improve:
- Win rate
- Expected value
- Reward potential
- Trade quality
And once traders truly understand this concept, they often begin seeing the market completely differently. (Not sure what timeframe to use? Learn more HERE.)
Trading Is a Battle for Positioning
A useful way to think about trading is to imagine you’re fighting a battle.
You want as many market participants on your side as possible.
You want:
- Day traders buying after you buy
- Swing traders entering after you
- Hedge funds building positions
- Institutional money pushing the move further
The best trades are rarely isolated.
They become powerful because multiple groups of participants are all reacting to the same setup simultaneously.
That’s where multi-timeframe analysis becomes so important.
Why Multiple Timeframes Matter
Every timeframe has different participants watching it.
Scalpers may focus on the one-minute chart.
Intraday momentum traders may care about the five-minute and fifteen-minute.
Swing traders often focus heavily on the daily chart.
Institutions frequently anchor decisions around larger timeframe structures.
When a trade setup only works on a tiny timeframe, the amount of participation behind the move can be limited.
But when the intraday chart and the daily chart are telling the same story, everything changes.
Now you have multiple groups acting together.
That creates stronger moves.
Stronger follow-through.
Higher expected value.
Why Expected Value Increases So Much
This is one of the most misunderstood concepts in trading.
When multiple timeframes align:
- Win rate often improves because there is greater confirmation
- Reward potential increases because larger participants can drive larger moves
- Risk frequently stays relatively similar because the trade can still use the same structural stop level
That combination is incredibly powerful.
You are not simply increasing one variable.
You are simultaneously improving probability and reward while maintaining relatively similar downside.
That is what creates exceptional expected value.
And over time, expected value is what drives trading performance.
The Best Trades Usually Look Obvious Across Timeframes
One of the most important patterns experienced traders notice is this:
The best longs usually look strong on both the intraday chart and the daily chart.
The best shorts usually look weak on both the intraday chart and the daily chart.
That alignment matters.
Because markets become far more powerful when participants across multiple time horizons are all responding to the same setup.
For example:
A daily breakout may attract swing traders.
At the exact same time, an intraday breakout may attract momentum traders.
At the same time, institutions may begin adding exposure because of the broader technical structure.
That convergence creates fuel.
What This Looks Like in Practice
Imagine a stock sitting just below a major multi-year resistance level on the daily chart.
Then earnings are released.
The stock gaps higher.
Suddenly:
- Institutions are reacting to the fundamental news
- Swing traders see a daily breakout
- Intraday traders see momentum
- Short sellers begin covering
Now multiple groups are all participating simultaneously.
This is often where the largest moves occur.
Not because of one single indicator.
But because many participants are all responding to the same information from different perspectives.
Why Capitulation Across Timeframes Matters
This concept also applies to reversals and short setups.
One of the most powerful situations occurs when both the daily chart and intraday chart simultaneously show signs of exhaustion.
For example:
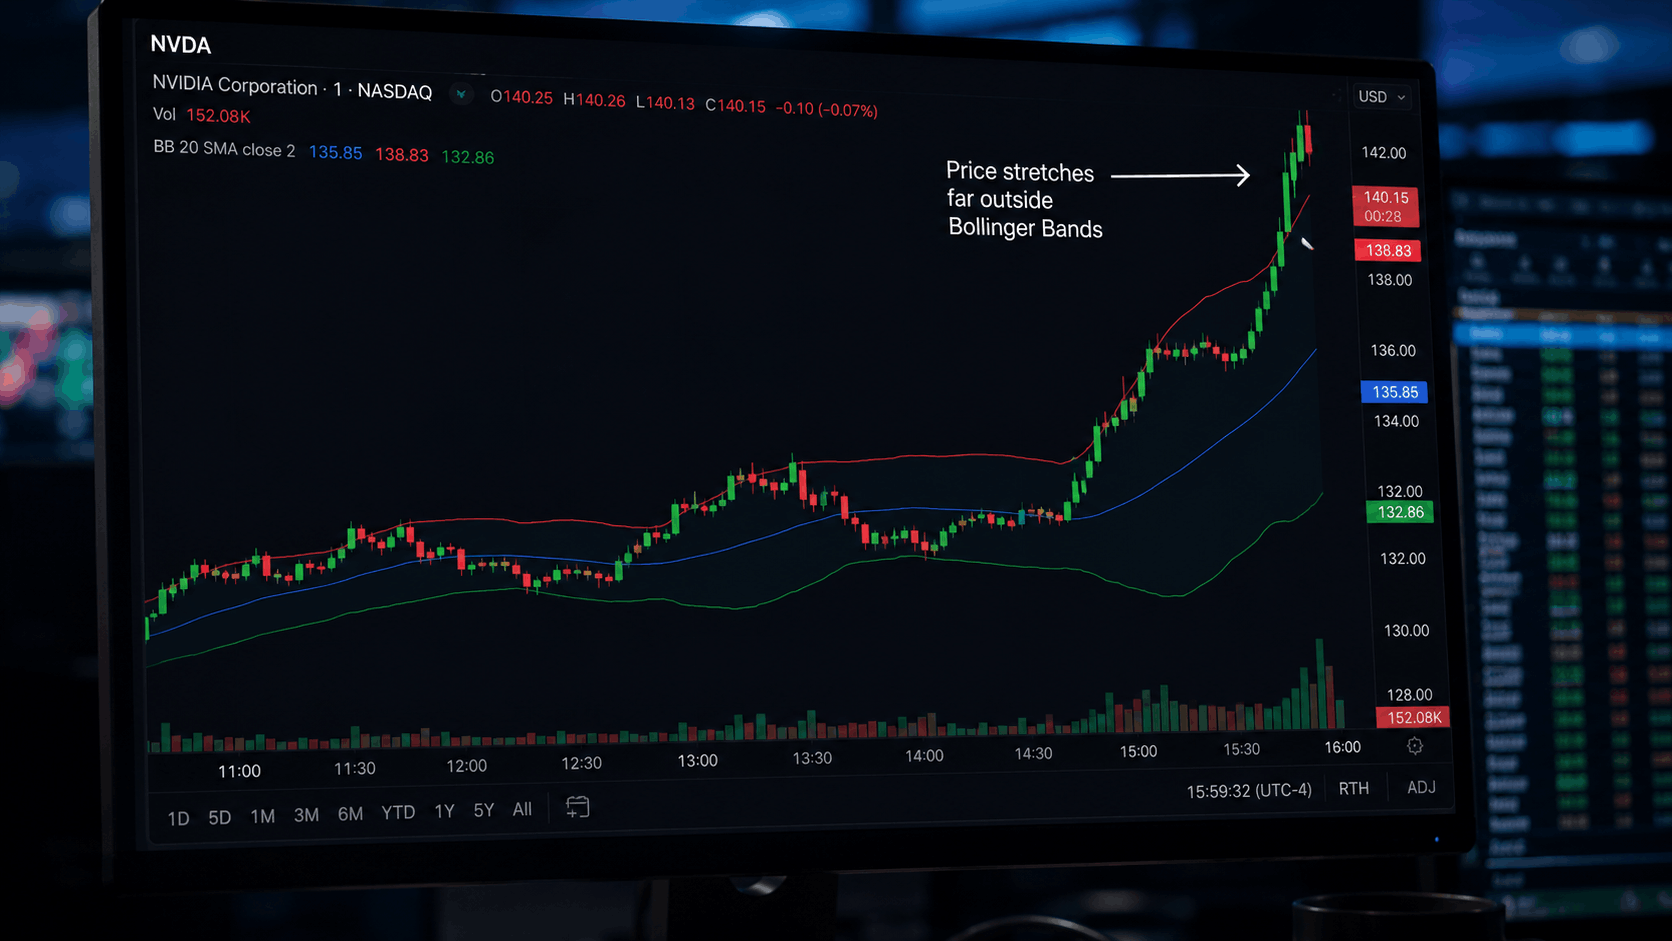
- A stock becomes massively extended on the daily chart
- Volume surges aggressively
- Price accelerates outside the Bollinger Bands
- Intraday action becomes climactic and unstable
Now both higher timeframe traders and lower timeframe traders may begin recognizing the same overextended conditions at once.
That alignment can create extremely high-quality reversal opportunities.
The Lower Timeframe Matters More Than Most Traders Realize
One of the most important advanced lessons in multi-timeframe trading is this:
The lower timeframe often carries more weight for execution decisions.
This surprises many traders.
They assume the higher timeframe always dominates.
But if you are entering based on intraday price action, the intraday chart usually matters more in that moment.
For intraday trading, the lower timeframe often reflects the immediate reality of supply and demand.
Even if the daily chart looks bearish, if the intraday action is steadily grinding higher with strong price behavior, fighting that strength can be extremely dangerous.
Likewise, a mediocre daily chart can still produce a great trade if the intraday setup is exceptional.
This is one of the nuances that takes traders years to internalize.
Your Stop Should Match the Timeframe
Another major mistake traders make is mismatching stops and setups.
For example:
- Entering a daily breakout trade but using a tiny intraday stop
- Entering an intraday trade but using an overly loose daily-chart stop
Professional traders usually align their stop placement with the timeframe that generated the trade idea.
A daily-chart trade should generally use a daily-chart stop.
An intraday setup should generally use an intraday stop.
This creates consistency between:
- The thesis
- The timeframe
- The volatility
- The risk structure
Without that consistency, traders often stop themselves out of perfectly good setups simply because their stop placement doesn’t match the nature of the trade.
Why Multi-Timeframe Analysis Works
At the end of the day, multi-timeframe analysis is really about alignment.
Alignment of:
- Participants
- Sentiment
- Structure
- Momentum
- Opportunity
The strongest trades occur when many different groups are all seeing the same thing at once.
That’s why experienced traders spend so much time studying context across multiple timeframes instead of focusing on only one chart.
Because when multiple timeframes align, you’re no longer trading alone.
You’re trading alongside an army of participants all pushing in the same direction.
What’s the next step? How about defining a trend? Learn more HERE!
