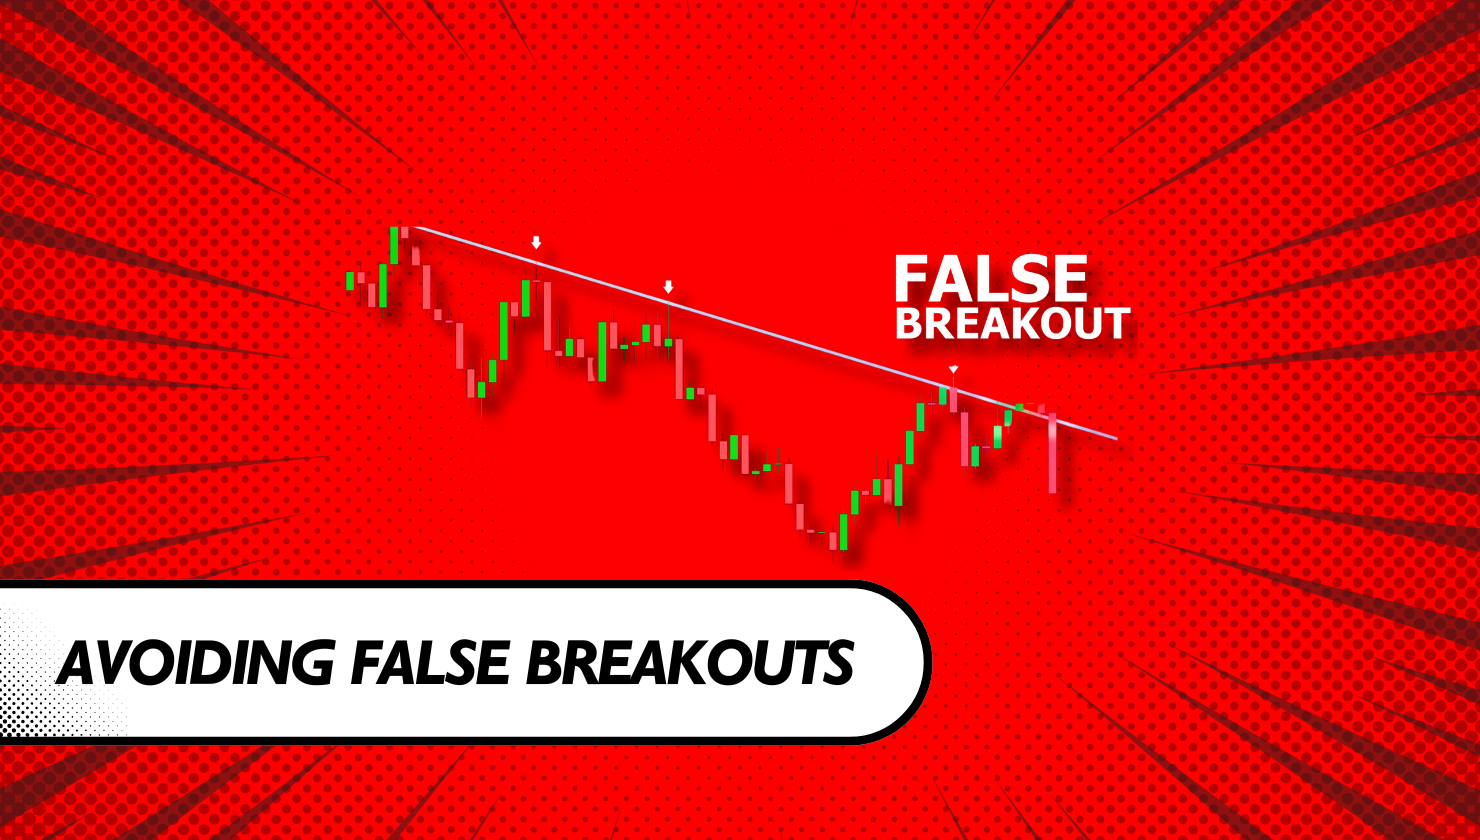

We’ve all been there — buying the breakout above resistance, only to watch price immediately roll back below the level and stop us out. One of the most common questions I get when it comes to choosing good setups is simple:
How do I avoid false breakouts?
The honest answer is: you can’t avoid them entirely.
But what you can do is dramatically tilt the odds in your favor. And the way you do that is by consistently trading the best stocks and the best setups within those stocks.
There Is No Magic Indicator
It’s tempting to search for a silver bullet — a magical indicator or secret strategy that filters out every losing breakout. Unfortunately, that doesn’t exist.
Avoiding false breakouts isn’t about certainty. It’s about stacking probabilities.
By understanding and weighting a combination of variables that most traders overlook, you increase your win rate — while accepting that even the best setups will sometimes fail.
That acceptance is not a weakness. It’s part of playing a probabilistic game correctly.
The Variables That Matter Most
Below are the core factors I use to assess whether a breakout is worth taking. No single variable is sufficient on its own — the power comes from confluence.
Fresh Breaking News
Stocks with fresh breaking news are far more likely to trade cleanly.
News drives:
- Real volume
- Active price discovery
- Stronger, longer trend legs
When a stock is moving without a catalyst, breakouts tend to be thinner, slower, and more prone to failure. Fresh news increases both the distance and number of legs a stock is capable of making.
Length of Consolidation
How long has the stock been range-bound?
Longer consolidations allow:
- Weak hands to sell
- Shorts to position
- Price to be accepted by the market
The more time spent consolidating, the fewer participants are eager to immediately sell or short at marginally higher prices once the level breaks.
Tightness of Consolidation
Not all consolidation is created equal.
The highest-quality setups:
- Coil tightly against resistance or support
- Show a series of higher lows (for breakouts) or lower highs (for breakdowns)
- Avoid wide, choppy, rangey bars
Despite what traditional technical analysis teaches, repeated tests of a level often increase the odds of a break — not weaken them — as supply or demand gets absorbed.
Relative Volume (RVOL)
When the level breaks, volume should expand meaningfully.
Ideally:
- Volume ramps into the breakout
- The actual break catches participants offside
Breakouts without volume confirmation are some of the most common sources of false signals.
Number of Prior Legs
How many legs has the stock already made?
Each additional leg reduces the odds of another clean continuation. The more extended the structure becomes, the more likely exhaustion and failure are.
Capitulation
Has the stock recently capitulated in price and volume?
If a stock has already experienced a major capitulatory move, breakouts above those highs are far more suspect — unless there has been extensive consolidation afterward.
Capitulation without digestion often leads to false continuation attempts.
Level 2 Dynamics
On a real breakout, the tape should confirm it.
What you want to see:
- Aggressive paying of the offer
- Thin offers
- Large, supportive bids
These are visual confirmations that buyers are far more motivated than sellers.
Multiple Timeframes Aligned
The more timeframes that align, the better.
When an intraday breakout coincides with:
- A daily level
- A weekly or monthly breakout
…you attract participants across multiple trading styles, significantly increasing the odds of follow-through.
Market Context
The broader environment matters.
Breakouts work better when:
- The overall market is strong
- The sector is in favor
A perfect setup in a dead market will often underperform. A good example of favorable context was semiconductor stocks throughout 2023 and early 2024.
Timing
There are rhythms to the trading day.
A common pattern:
- Opening drive
- Midday consolidation
- Afternoon continuation
Midday breakouts often struggle due to lower volume and trader skepticism. Understanding timing helps contextualize whether a breakout has the energy to sustain itself.
Putting It All Together
Every variable discussed here applies equally to breakouts and breakdowns.
And this list is not exhaustive.
Over time, you’ll develop sensitivity to additional factors — such as short interest, float dynamics, or volume relative to float — that are specific to your own system.
The key question to ask yourself is:
Which variables actually move the needle in my trading?
Final Thought
When I see traders struggling — getting chopped up by endless false breakouts — it’s rarely due to bad luck. It’s usually because one or more of these variables were ignored, misweighted, or misunderstood.
You don’t need perfection.
You need structure, context, and discipline.
Stack those consistently, and false breakouts become less frequent — and far less damaging — over time.
Looking for a quick tool to level up your trading? Try the Daily Report Card, DRC for short.
